


Plotting Coordinates for Land Navigation at the Sawmill FTX
You learned how to do it in the 5th grade ... finally it's useful

Why do we plot our grids with latitude and longitude at the Sawmill FTX instead of MGRS (Military Grid Reference System)?
We use latitude and longitude because it is a global system that is accessible to everyone everywhere. At the Sawmill FTX, we do not use the Military Grid Reference System (MGRS). MGRS is used by a few western militaries. If you ever need to specify your location in real life, it is virtually certain that latitude/longitude will be understood. MGRS: not so much unless you are talking to a western military person with a military map.
Any point on earth can be located with latitude and longitude. MGRS only works between 84 degrees North and 80 degrees south – which I grant is most of the world but it is not all the earth.
MGRS is inherently a somewhat local plotting system. MGRS divides the world into 1200 “zones”. To plot a location, it locates one of those zones and does the plotting within that zone. It is simpler within that zone but if you need to cross zones, it becomes more complex.
Finally, latitude and longitude are easier because you have already learned how to plot using a two-dimensional grid system. You probably learned it in grade school and now you have a practical use for it. It may well be that you are still waiting for “y = mx + b” to become useful.
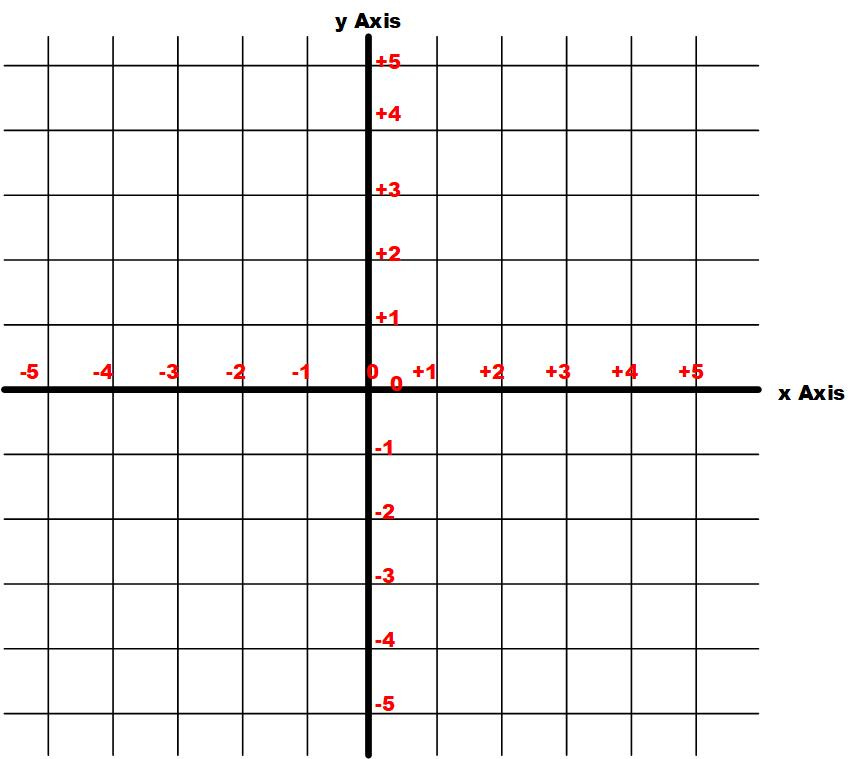
Latitude and longitude are an “x, y” grid system just like the grids that you started learning somewhere about the fifth grade. If you remember that throughout the plotting process, it makes things much easier. Just like back in the fifth grade, positive numbers go up or to the right from the origin (0,0). Negative numbers go down or to the left of the origin (0,0).
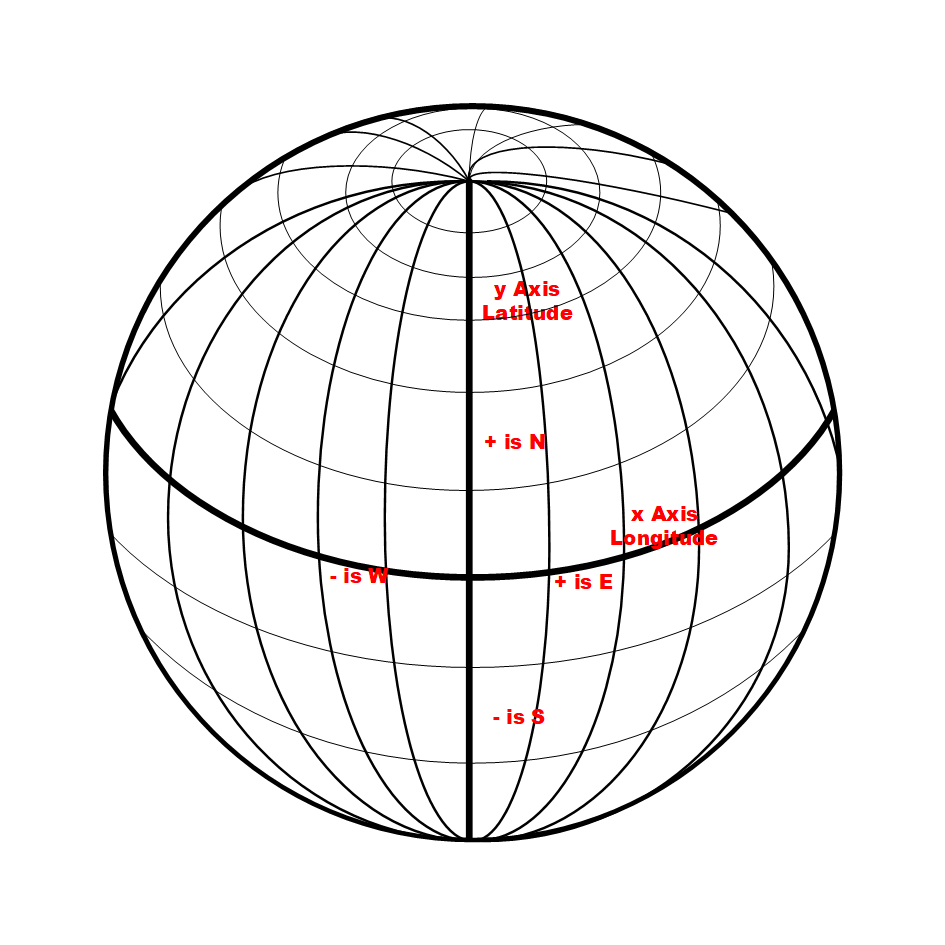
For that to work for plotting in latitude and longitude, we must wrap or project the grid onto the surface of the earth. When we do that the lines curve. Up from the origin becomes North. Right from the origin becomes East. Down from the origin becomes South and left from the origin becomes West. You will sometimes see Westerly longitudes expressed as negative numbers instead of West.
The origin line for longitude (zero degrees longitude) passes through Greenwich, England. The reason for that is an interesting story that we do not have space for here. Wikipedia[1] is your friend for more information.
The origin line for latitude is the equator. Where the prime meridian (the longitude line through Greenwich) and the equator intersect is our 0,0 point (origin) for plotting locations using longitude and latitude. That point is off the west coast of Africa in case you are interested. To see it, go to Google Earth and type 0,0 into the search bar.
At the Sawmill FTX, we specify our latitude and longitude grids in degrees, minutes, and seconds.
There are 360 degrees in a circle. The grid lines shown previously are “circles” around the earth. Minutes and seconds are subdivisions (smaller units) of degrees. A minute is 1/60th of a degree and a second is 1/60th of a minute.
Longitude is measured along the x axis beginning at the prime meridian. Longitudes west of the prime meridian (e.g., North America) are Westerly or negative. As in “x, y” grids negative numbers increase from right (East) to left (West).
Latitude is measured from the equator. Northern hemisphere latitudes are positive (N) numbers and southern hemisphere latitudes (S) are negative. Northern hemisphere latitudes start at zero at the equator and increase as you go north from equator to North pole. Southern hemisphere latitudes start at zero at the equator and increase as you go south from the equator to the South pole.
Depending on the scale of the map, the grid may be printed on the map in 1 degree boxes or 1 minute boxes or 15 second boxes. The Sawmill map for the FTX has 15 second grid squares (boxes).
Plotting is locating the nearest grid square (box) on your map and then doing an “x, y” plot within that grid square from the origin of the grid square. In the Northern and Western hemisphere, the origin is at the bottom right corner of the box and you plot up and left from that origin. You can plot left first or up first. It does not matter which one you do first as long as you don’t mix up the latitude and longitude numbers.
To emphasize a little bit, in the Northern and Western hemisphere where we are in North America, your “x” number (longitude) is negative and your “y” number (latitude is positive) and you plot from the bottom right corner of your grid square. That is different in each of the of other hemispheres.
Practical Example
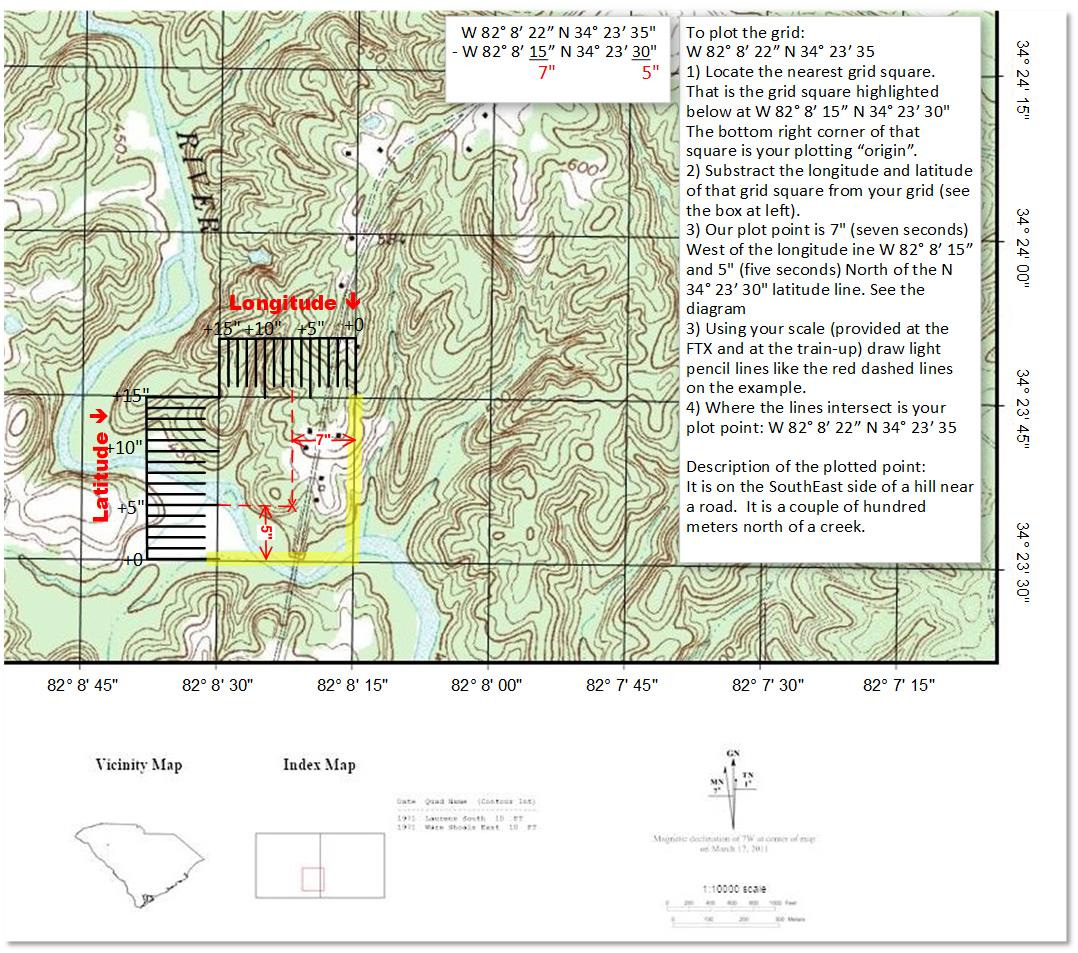
For our example, we will plot the grid W 82° 8’ 22” N 34° 23’ 35” on our Sawmill map fragment (the picture at the beginning of this article). The instructions are on the map fragment but if you are reading this on a phone, the instructions on the map fragment will be unreadable.
The map and scale will be provided at the train-up and at the Sawmill FTX.
To plot the grid: W 82° 8’ 22” N 34° 23’ 35”
Locate the nearest grid square. That is the grid square highlighted below at W 82° 8’ 15” N 34° 23’ 30"
The bottom right corner of that square is your plotting “origin.”
Subtract the longitude and latitude of that grid square from your grid.
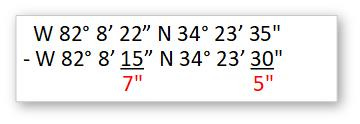
Our plot point is 7" (seven seconds) West of the longitude line W 82° 8’ 15” and 5" (five seconds) North of the N 34° 23’ 30" latitude line. See the diagram and remember that West is a negative “x” number in the “x, y” plotting system.
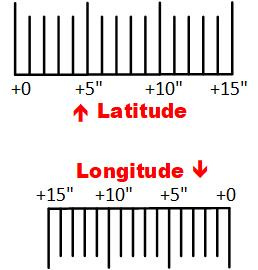
Using your scale (shown above — provided at the FTX and at the train-up) draw light pencil lines like the red dashed lines on the example.
Notice that the plotting scale has a side marked Latitude and a side marked Longitude. Lat/Long grid squares are roughly rectangular. As you go further north the longitude lines converge until they meet at the North Pole. Longitude scales are specific to a given latitude. This scale is specific to the Sawmill FTX map at 34 degrees north latitude.
Where the lines intersect is your plot point: W 82° 8’ 22” N 34° 23’ 35”
This is what it looks like on the map.
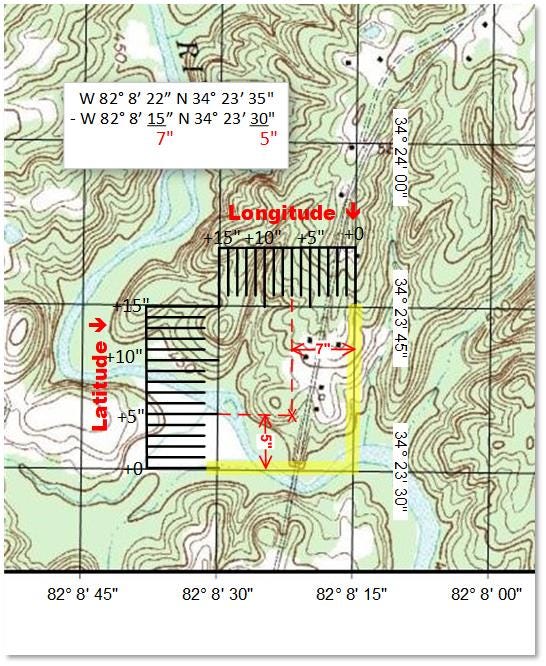
Description of the plotted point: It is on the Southeast side of a hill near a road. It is a couple of hundred meters north of a creek.
Summary
Latitude and longitude are an “x, y” coordinate system that can be used to locate any point on earth. Plotting a location using latitude and longitude is plotting in a two-dimensional grid system.
To plot a location using latitude and longitude locate the nearest grid square and then use a corner of that grid square as the plotting origin. The corner that you will use depends on what hemisphere the grid square is located in. Subtract the “origin” corner from your (to be plotted) grid and plot the remainder from the origin corner.
We use latitude and longitude at the Sawmill FTX because it is a global grid reference system available to everyone anywhere on Earth.
Register
Sawmill FTX — https://practiscore.com/sawmill-ftx-january-7-2024/register
Trainup — https://practiscore.com/sawmill-land-navigation-and-medical-trainup-4-january-2024/register
[1] https://en.wikipedia.org/wiki/Prime_meridian